
Run an attendance report
Which attendance report to use (sign-in/out records, change history, or daily counts), and how to print any of them as a PDF.
NestliCare has three attendance reports under Reports → Attendance & Safety. Pick the one that matches what you were asked for:
| You need | Use |
|---|---|
| The attendance records themselves: each child's name, the date, exact sign-in and sign-out times, and who signed them in and out (for licensing, a subsidy agency, or your own files) | Arrivals & Departures |
| Proof of what was changed afterward: every edit, deletion and day entered later, with who made it and when | Attendance Change History |
| Daily totals: how many children were present or absent each day | Attendance Summary (counts only, no child names) |
Arrivals & Departures (the sign-in/out records)
- Go to Reports and pick Arrivals & Departures.
- Pick the center, an optional room, and the date range (for example, last month).
- Click Print and save as PDF, or Export CSV.
Each row is one child's stay: the child's name, room, date, check-in time, who signed them in, check-out time, who signed them out, and the hours. Times are exact to the minute, never rounded. Each child has their own row, siblings included.
- Who signed shows the adult's name and relationship ("Maya Lee (Mother)") or the staff member, plus how it was recorded: Kiosk, QR code, Staff app, Room tablet, or Added later by staff.
- If your center collects a signature at check-in (Settings → Operations → Check-in Methods), the drawn signature prints in the row.
- An Edited tag means the times were changed after they were recorded. The Attendance Change History report shows who changed them, when, and what they were before.
- An Auto tag on a check-out means no one checked the child out, and the center's closing time was filled in.
A child who left and came back the same day (before and after school, a midday appointment) has one row per stay.
Attendance Change History
See Attendance Change History.
Attendance Summary (daily counts)
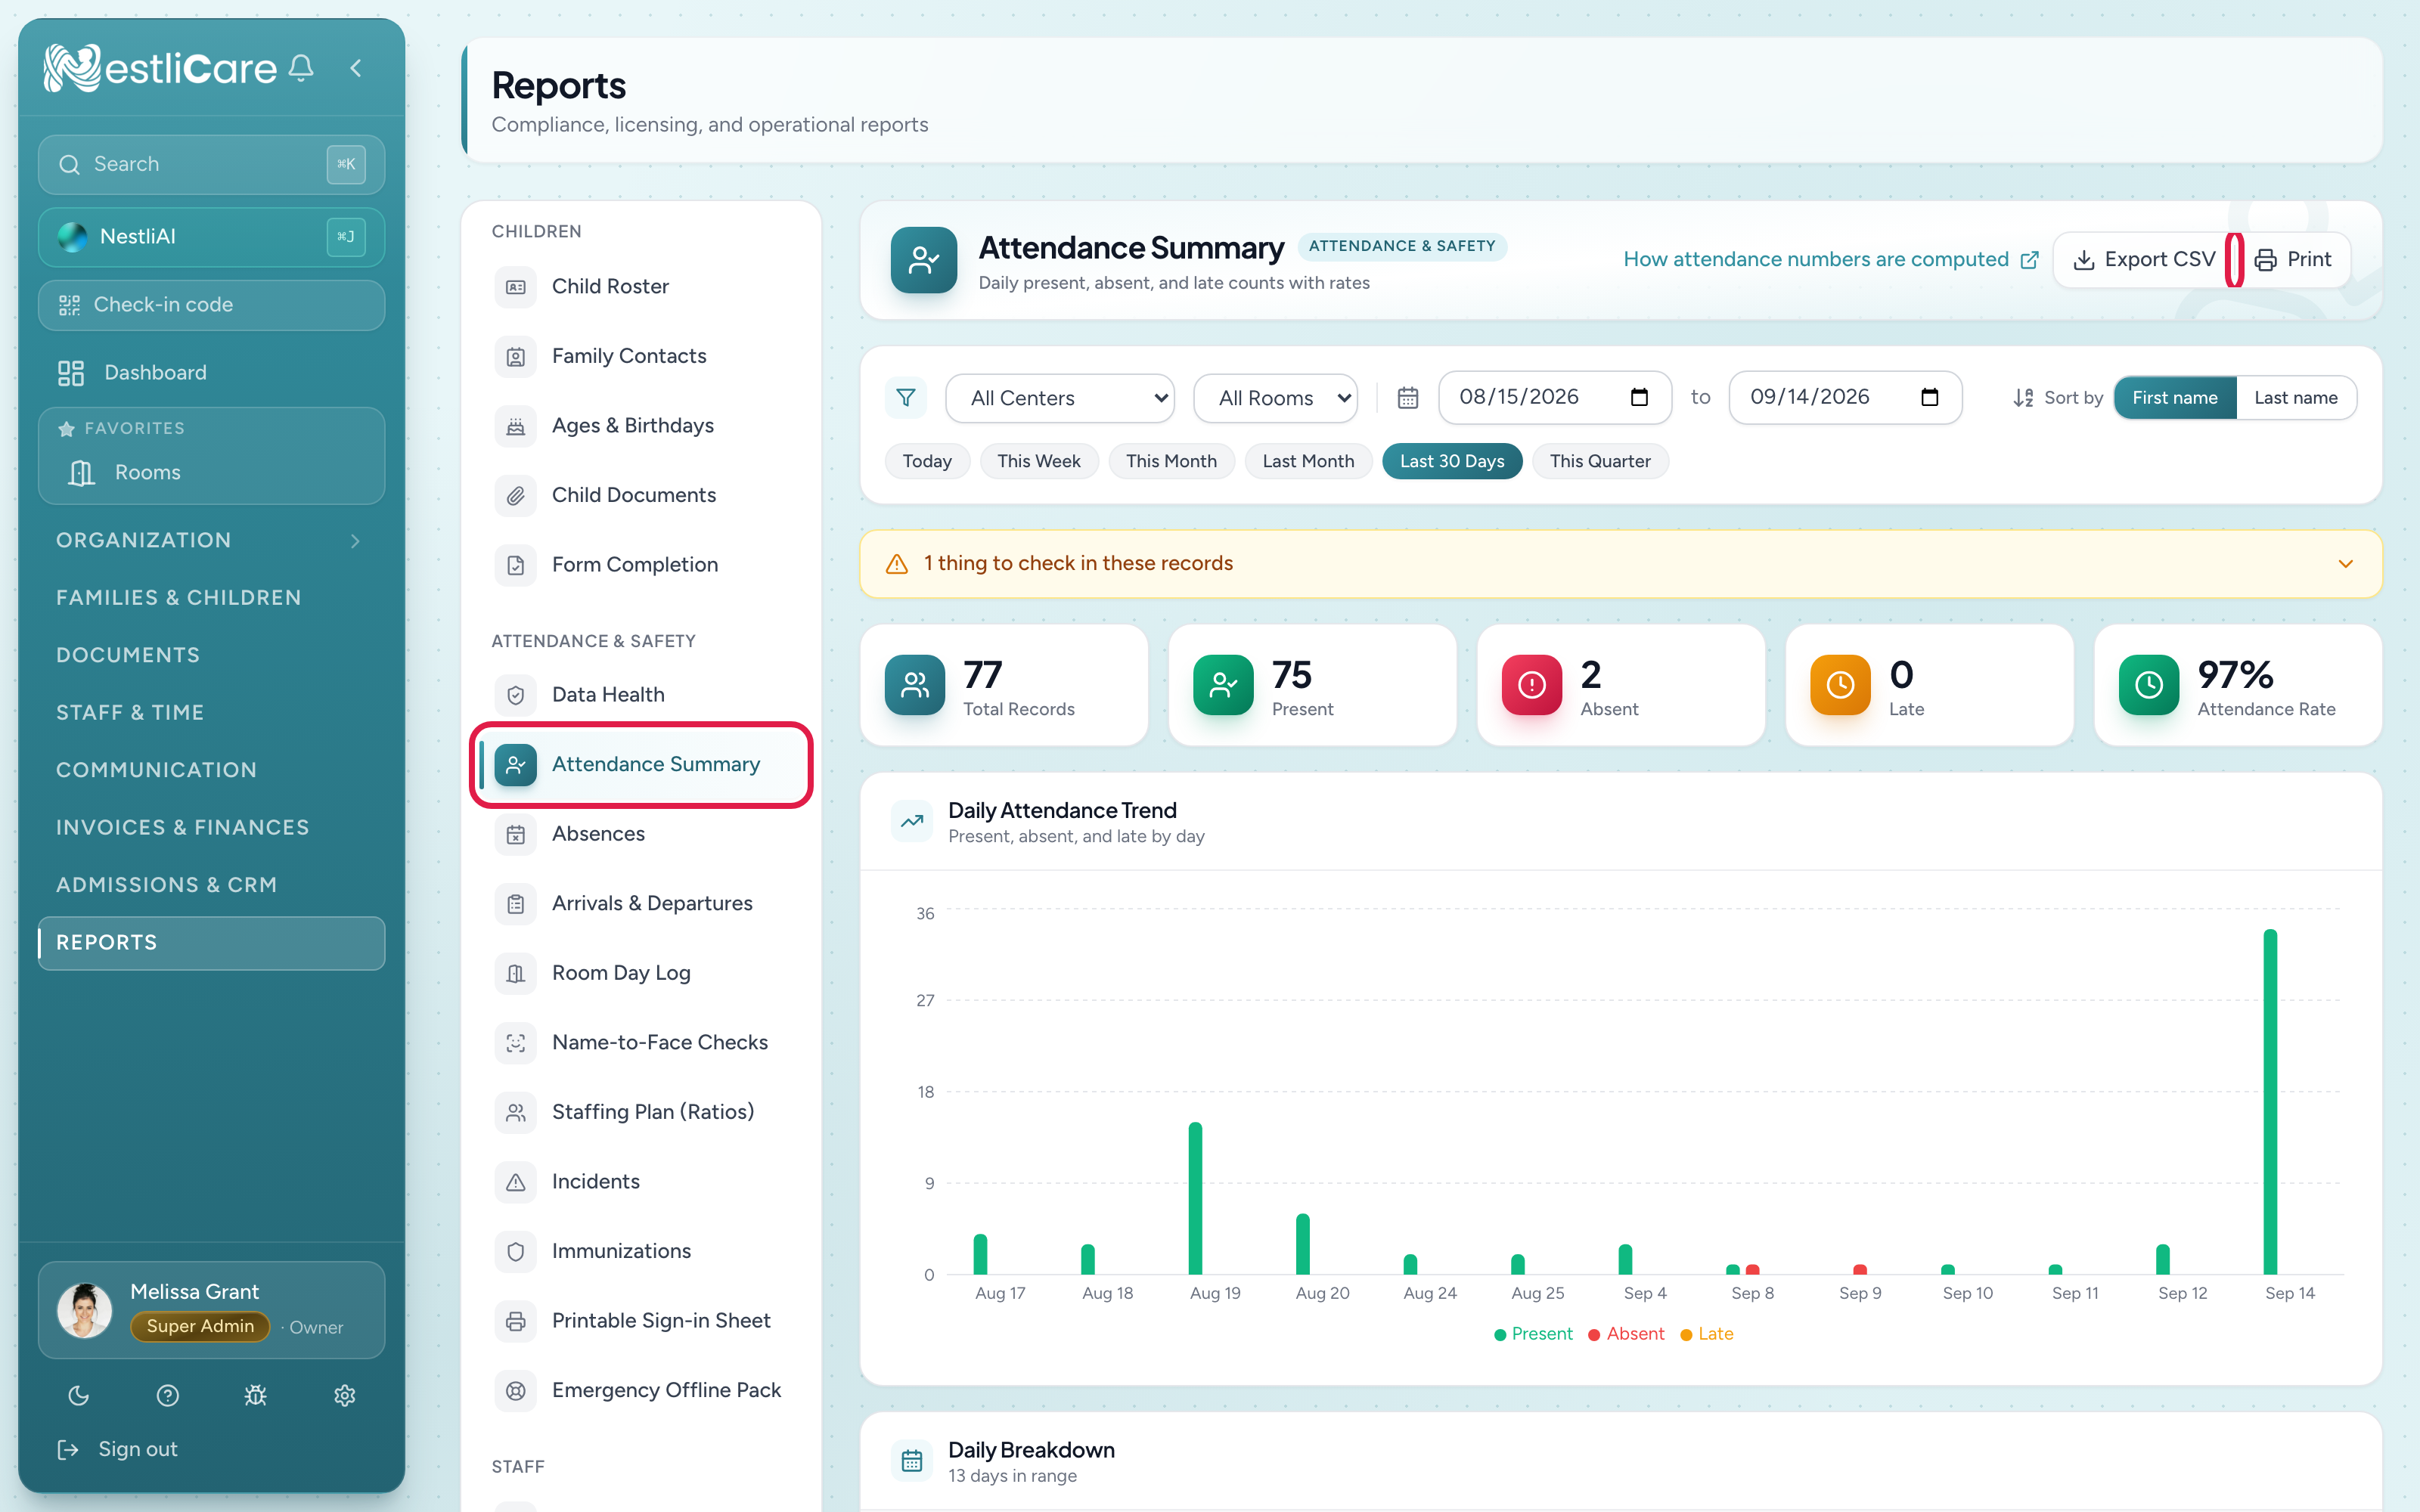
The summary tells you, for any date range, how many children were present / absent / late each day, and flags missing check-outs. It has no child names; use Arrivals & Departures when you need the records.
Run it
- Go to Reports and pick Attendance Summary under Attendance & Safety.
- Pick the center (or "All centers"), optional room, and a date range.
- The report loads.
What each stat means
- Total Records — total attendance entries (check-ins + explicit absences)
- Present — children who were checked in at some point that day, whether or not they have been checked out yet
- Absent — marked absent by staff or parent. A day the center was closed on the calendar is never an absence here, even for a child whose state subsidy program files it as a closed day.
- Late — NestliCare doesn't mark late arrivals yet, so this reads 0
- Attendance Rate —
(Total Records − Absent) / Total Recordsas a %
A child does not have to be in the building right now to count as present. Running the report for last month while the center is closed still shows every day's real attendance. The CSV export also includes the raw checkedIn and checkedOut columns; those describe each record's current state (still in the building vs. already picked up), which is why checkedIn is 0 for any past day.
Reading the daily table
The Rate column color:
- Green (90% and up) — attendance looks healthy
- Amber (75–90%) — some absences; worth checking
- Red (below 75%) — something's up — illness outbreak, closure, data gap
Dates with red rates are the ones to investigate first.
Common use cases
Month-end compliance snapshot
- Filter to the prior calendar month.
- Export CSV.
- Attach to your monthly licensing compliance file.
Week-over-week illness tracking
- Run for this week and last week separately.
- Compare absent counts. Big jumps often mean norovirus or strep going around.
Spotting missing check-outs
The report's Data Quality banner at the top surfaces incomplete records — children who checked in but have no check-out. Click through to Data Health to see the specific rows.
Export and annotations
- Export CSV — a spreadsheet with one row per day in the range.
- Annotations at the bottom — add context for the period ("Snow closure 1/15, counts down across the board").
Troubleshooting
Report shows zero records but I know kids were here. Either your date range is wrong, or the center picker doesn't include the right center. Check both.
Attendance rate looks really low but we were fully enrolled. Missing check-ins (staff didn't register some kids). Go to Data Health and fix each.
Export CSV has a different total than the on-screen stat card. The CSV is daily-grouped; the stat card is aggregated across the range. They should match totals — if they don't, refresh.
Late is always 0. That's expected. Late arrivals aren't tracked yet.
"Absent" rows with no reason. Some parents don't submit a reason when marking their child absent. That is allowed and is not treated as a data quality issue. Use the Absences report's "by reason" breakdown if you want to follow up.