
See the current enrollment snapshot
Get a live view of how many children are enrolled, their status breakdown, and distribution across centers.
The enrollment report is current state only — no date range. Every time you load it, you see how many active, pending, and withdrawn children you have right now, broken down by center.
Use it for forecasting, monthly rollups, and answering the "how many kids do we have?" question.
Run it
- Reports → Enrollment in the sidebar.
- It loads immediately — no filters needed.
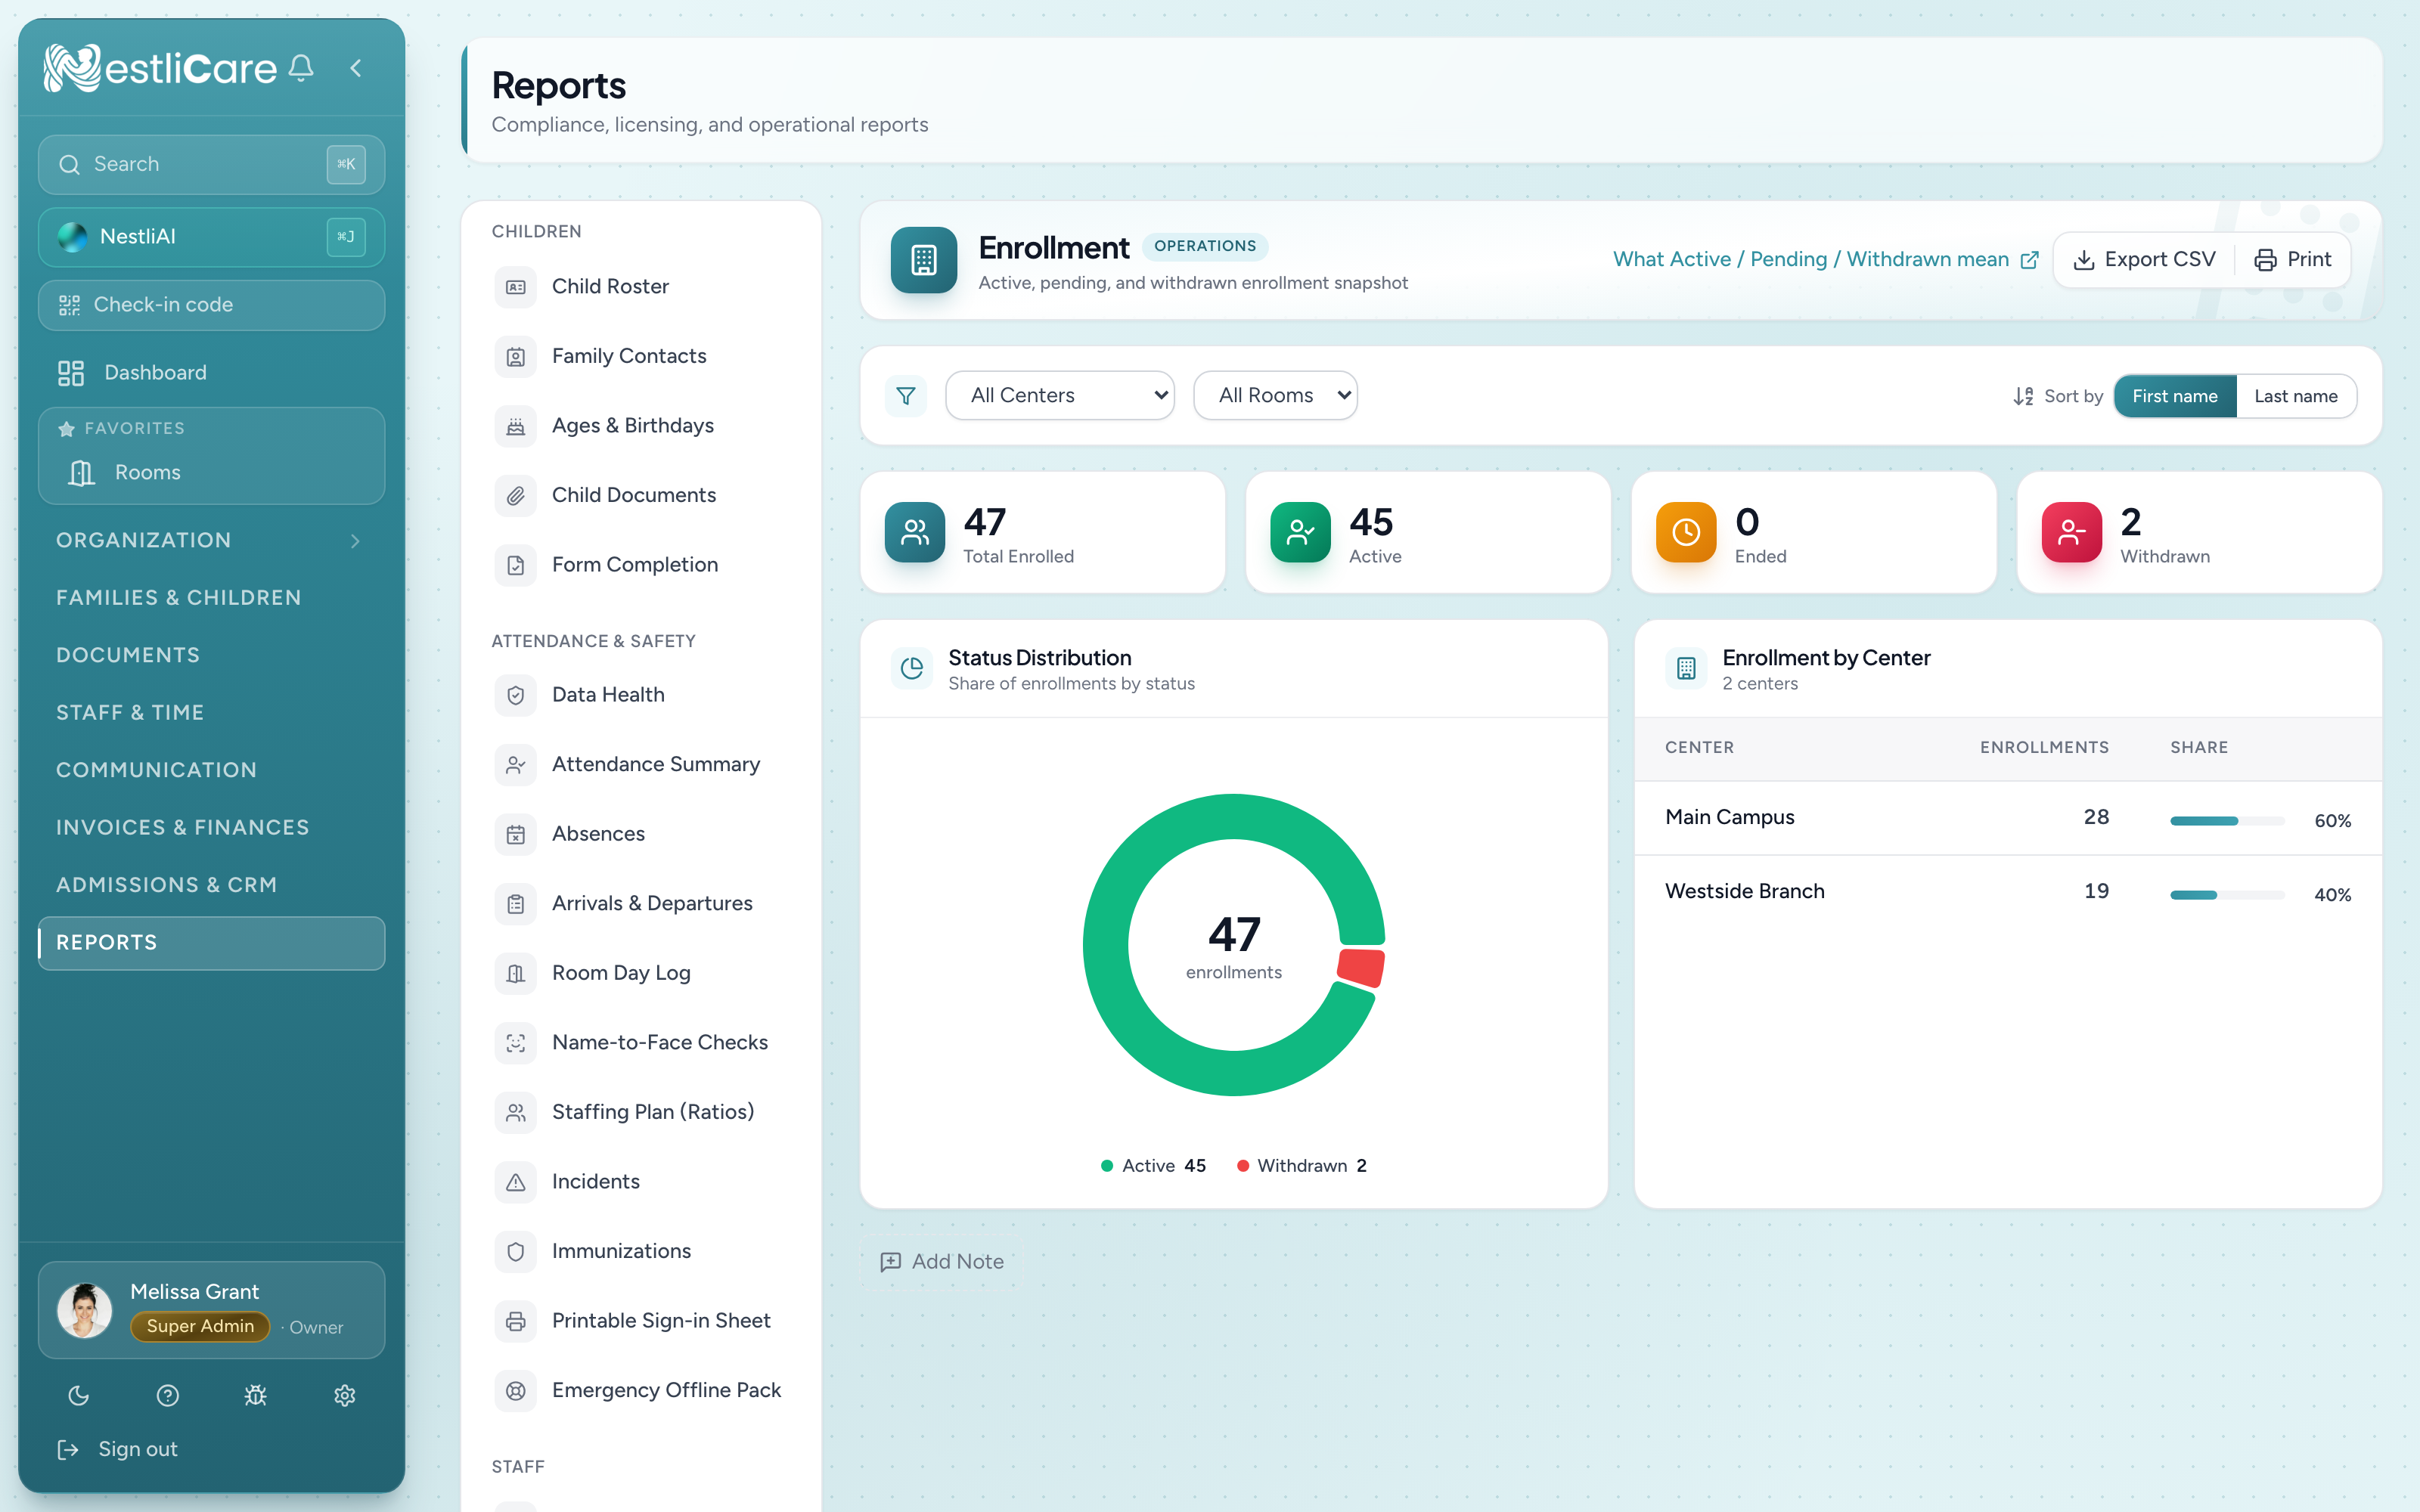
Status meanings
- Active — enrolled and attending. What your capacity planning cares about.
- Pending — enrolled but haven't started yet (future start date, or waiting on paperwork)
- Withdrawn — formerly enrolled, no longer attending. History, not current
The Total Enrolled stat card is the sum of all three. For current operational planning, focus on Active.
Common use cases
Monthly board report
Most centers show a "current enrollment by center" chart to their board each month:
- Run the report.
- Screenshot or export CSV.
- Paste into your monthly update deck.
Capacity utilization
Cross-reference with Room Ratios to see how close to licensed capacity you're operating. If you're at 85% enrolled across centers, you're healthy. At 100%, you're turning families away — time to think about expansion. At 60%, figure out why.
Forecasting for waitlists
Subtract Active from room-capacity totals to see how many open spots exist. Compare to your waitlist / lead pipeline. This drives admissions timing.
What the report doesn't show
- Enrollment dates or history — current state only, no trends
- Per-child detail — use the Children or Families page for individual records
- Financial status — enrolled children with unpaid invoices aren't differentiated here; see billing reports for that
Export and print
- Export CSV — Center, Enrollments, Percent. Filename:
enrollment-{today}.csv. - Print — pie chart + table.
Annotations let you add context: "April snapshot — Westside Center has 3 pending pending paperwork from overseas transfers."
Troubleshooting
Active count doesn't match what I know we have. Check that all active enrollments have the right status. Withdrawn children still show — just under a different category. Sum all three categories to double-check.
Pending count is higher than expected. Pending means future start date or incomplete paperwork. Go to Families & Children → Families and filter to pending to see each. Usually the fix is: start date already passed, status hasn't been bumped to Active.
Withdrawn children still appear. By design — historical records stay. If you want to exclude them, filter by center in the other reports (Enrollment has no withdrawn-hide filter).
Multi-site org shows the same center twice. Likely a duplicate center record from a migration. Contact [email protected] to merge.
Pie chart looks empty. All three categories are 0 — you have no enrollment records yet. Add some children first.